Yesterday, I assisted my buddy in resolving a problem related to log collection. She was trying to send Windows logs to CloudWatch but kept encountering an error. Using this as an opportunity, I’d like to guide you through the process of sending Windows and Linux logs to CloudWatch.
AWS CloudWatch monitors AWS resources and the applications run on AWS. You can use CloudWatch to collect and track metrics, collect and analyze logs whatever on the cloud or on-premises.
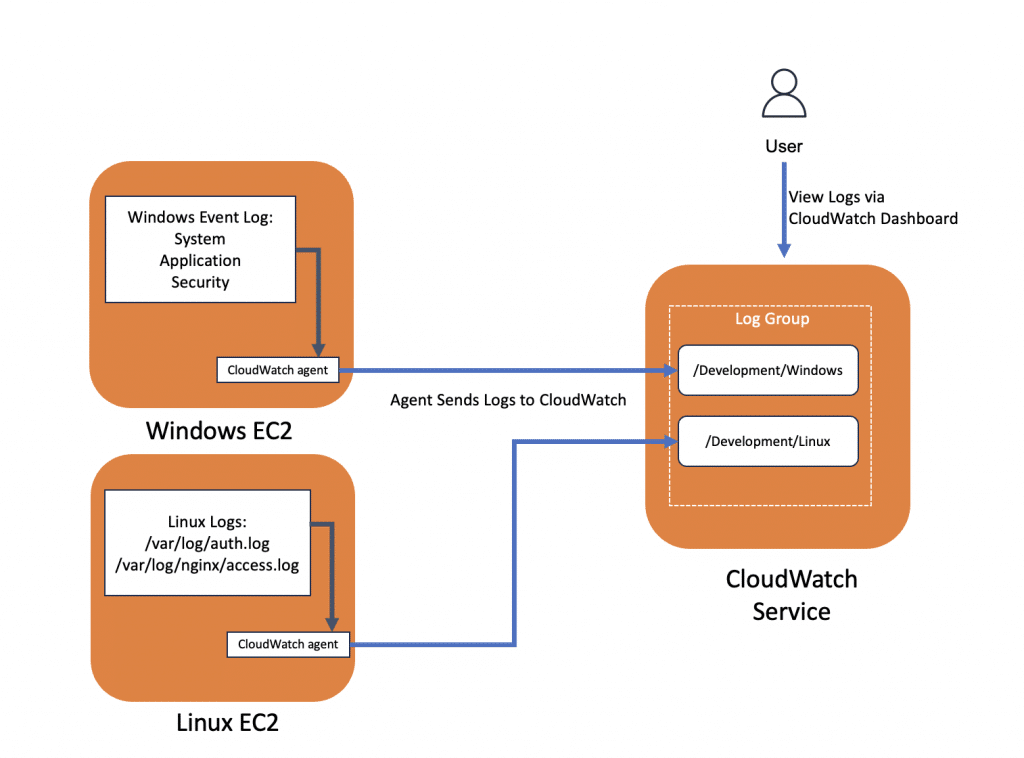
Steps for sending logs to CloudWatch
- Create IAM Role with specific policy and attach to instances.
- Install the CloudWatch agent in the instances
- Create the CloudWatch configuration manually, you can use wizard to create.
- Start the CloudWatch agent service
- Check the logs in CloudWatch portal
Create AWS Role for CloudWatch
- Head over to IAM -> Roles -> Create role -> AWS Services -> EC2 -> select CloudWatchAgentServerPolicy -> Input Role name -> Create Role
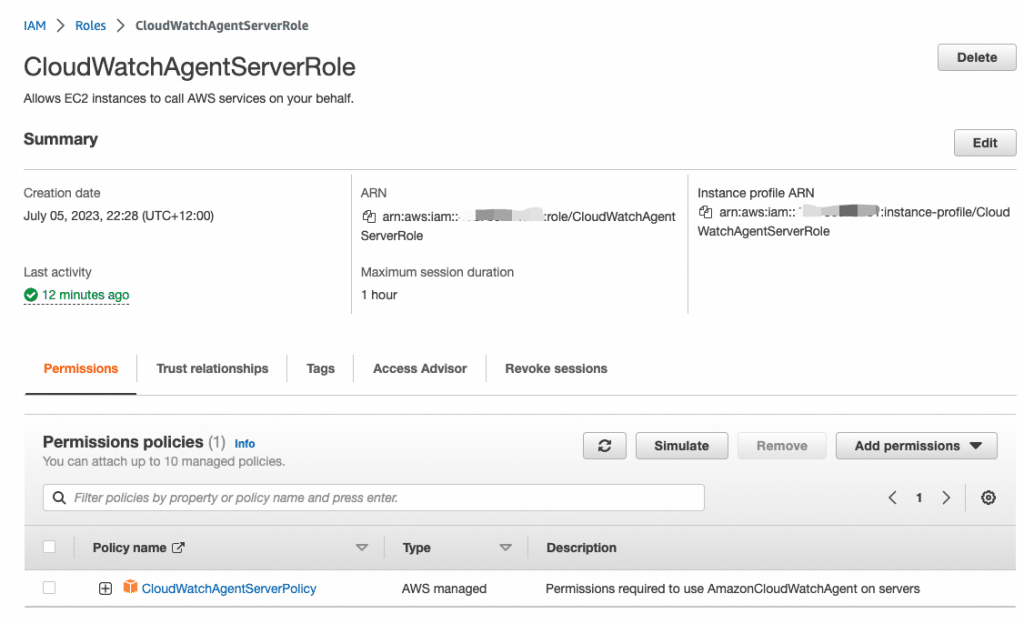
2. Launch instance and attach the role CloudWatchAgentServerRole to it.
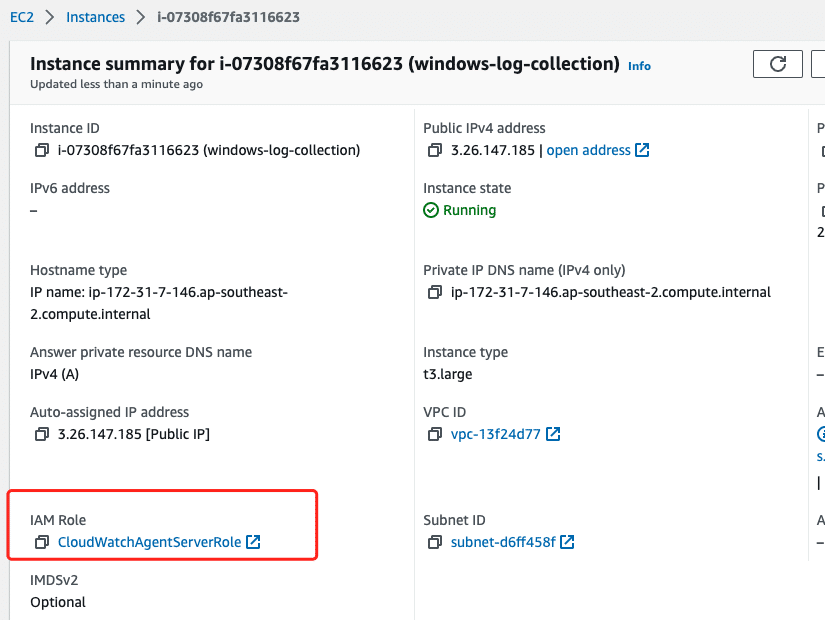
Windows Server
Install the CloudWatch agent in the instances
Use RDP tool to access the Windows Server and install
Download the Windows version agent installation file, install it.
https://s3.amazonaws.com/amazoncloudwatch-agent/windows/amd64/latest/amazon-cloudwatch-agent.msiYou can find the all platform agent from CloudWatch agent downloads page
Configure CloudWatch Agent
The CloudWatch agent configuration is a JSON file with three sections: agent, logs and metrics.
The agent section is for the overall configuration.
The logs section specifies what log are sending to CloudWatch. You can collect WIndows Event Log and your application logs.
The Metrics section is for collecting instance metrics, like CPU, Memory, Disk, Network. Three methods are supported: Basic, Standard and Advanced. you can disregard this section if you are only collecting logs.
The following is an example of a complete CloudWatch agent configuration for Windows Server.
{
      "agent": {
        "metrics_collection_interval": 60,
        "logfile": "c:\\ProgramData\\Amazon\\AmazonCloudWatchAgent\\Logs\\amazon-cloudwatch-agent.log",
		"region": "ap-southeast-2"
      },

	  "logs": {
        "logs_collected": {
          "files": {
            "collect_list": [
              {
                "file_path": "c:\\ProgramData\\Amazon\\AmazonCloudWatchAgent\\Logs\\amazon-cloudwatch-agent.log",
                "log_group_name": "/Development/Windows/",
				"log_stream_name": "{local_hostname}/cloudwatch-agent_log",
                "timezone": "UTC"
              },
              {
                "file_path": "c:\\ProgramData\\Amazon\\AmazonCloudWatchAgent\\Logs\\test.log",
                "log_group_name": "/Development/Windows/",
				"log_stream_name": "{local_hostname}/test_log",
                "timezone": "Local"
              }
            ]
          },
          "windows_events": {
            "collect_list": [
              {
                "event_name": "System",
                "event_levels": [
                  "INFORMATION",
                  "ERROR"
                ],
                "log_group_name": "/Development/Windows/",
                "log_stream_name": "{local_hostname}/System",
                "event_format": "xml"
              },
			  {
                "event_name": "Application",
                "event_levels": [
                  "INFORMATION",
                  "ERROR"
                ],
                "log_group_name": "/Development/Windows/",
                "log_stream_name": "{local_hostname}/Application",
                "event_format": "xml"
              },
              {
                "event_name": "Security",
                "event_levels": [
                  "INFORMATION"
                ],
                "log_group_name": "/Development/Windows/",
                "log_stream_name": "{local_hostname}/Security",
                "event_format": "xml"
              }
            ]
          }
        }
      },
	"metrics": {
		"namespace": "Development/SY-1-Metrics",
		"aggregation_dimensions": [
			[
				"InstanceId"
			]
		],
		"append_dimensions": {
			"AutoScalingGroupName": "${aws:AutoScalingGroupName}",
			"ImageId": "${aws:ImageId}",
			"InstanceId": "${aws:InstanceId}",
			"InstanceType": "${aws:InstanceType}"
		},
		"metrics_collected": {
			"LogicalDisk": {
				"measurement": [
					"% Free Space"
				],
				"metrics_collection_interval": 60,
				"resources": [
					"*"
				]
			},
			"Memory": {
				"measurement": [
					"% Committed Bytes In Use"
				],
				"metrics_collection_interval": 60
			},
			"Paging File": {
				"measurement": [
					"% Usage"
				],
				"metrics_collection_interval": 60,
				"resources": [
					"*"
				]
			},
			"PhysicalDisk": {
				"measurement": [
					"% Disk Time"
				],
				"metrics_collection_interval": 60,
				"resources": [
					"*"
				]
			},
			"Processor": {
				"measurement": [
					"% User Time",
					"% Idle Time",
					"% Interrupt Time"
				],
				"metrics_collection_interval": 60,
				"resources": [
					"*"
				]
			}
		}
	}
  }
Start CloudWatch agent service
Run services.msc in cmd or PowerShell, find CloudWatchAgent Service to start.

Validating Window Event logs in CloudWatch Portal
Once service is running, all logs that you’ve defined in the configuration file will be sent to CloudWatch. You can view these logs under Logs section.
As you can see, /Development/Windows/ log group has been created automatically.

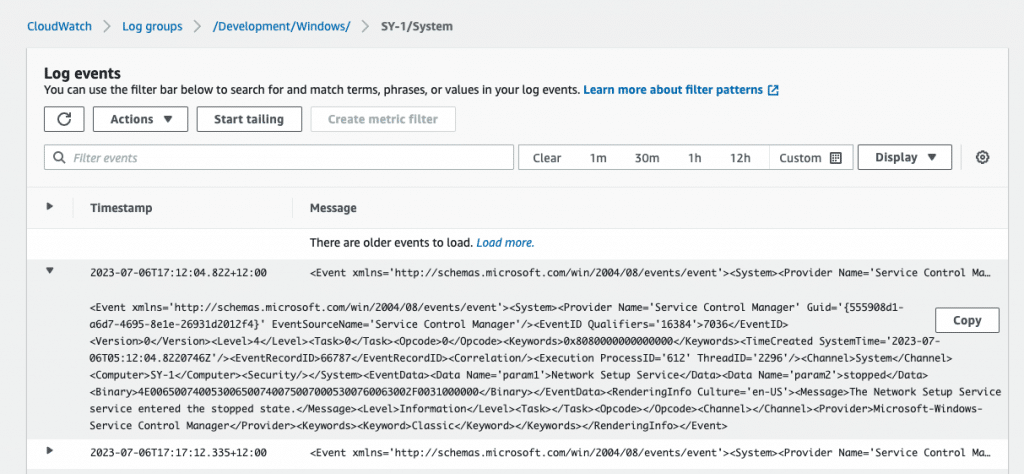
When you click on the log group, you can view the logs.
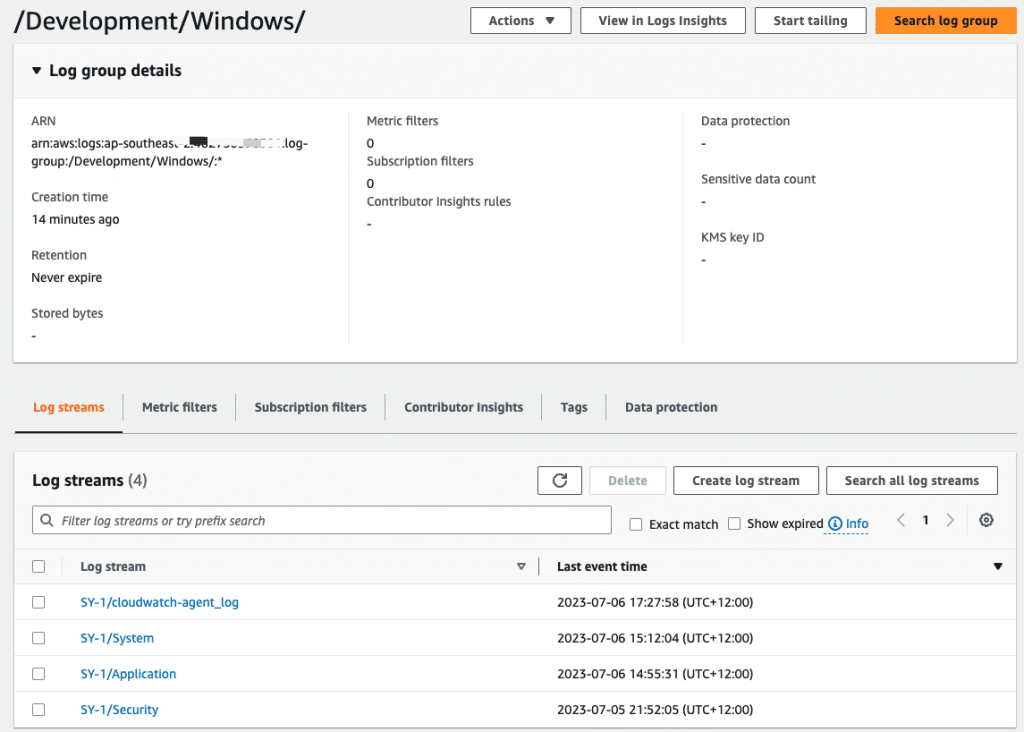
Check System Event of SY-1 instance
Linux Server
Install the CloudWatch agent
In this case, I will collect following logs and system metrics using collectd.
- CloudWatch agent log
- Auth Log from /var/log/auth.log
- Nginx access log from /var/log/nginx/access.log
Install Nginx and collectd
apt-get update -y
apt-get install nginx && collectd -y
SSH to Ubuntu to install agent.
- Download and install agent on Ubuntu 22.04
$ wget https://s3.amazonaws.com/amazoncloudwatch-agent/ubuntu/amd64/latest/amazon-cloudwatch-agent.deb
$ sudo dpkg -i amazon-cloudwatch-agent.deb
Configure CloudWatch Agent
Create amazon-cloudwatch-agent.json under /opt/aws/amazon-cloudwatch-agent/etc/
{
	"agent": {
	  "metrics_collection_interval": 10,
	  "run_as_user": "root"
	},
	"logs": {
	  "logs_collected": {
		"files": {
		  "collect_list": [
			{
			  "file_path": "/opt/aws/amazon-cloudwatch-agent/logs/amazon-cloudwatch-agent.log",
			  "log_group_name": "/Development/Liunx/",
			  "log_stream_name": "{local_hostname}-{ip_address}-cloudwatch-agent-log",
			  "timezone": "Local"
			},
			{
			  "file_path": "/var/log/auth.log",
			  "log_group_name": "/Development/Liunx/",
			  "log_stream_name": "{local_hostname}-{ip_address}-auth-log",
			  "timezone": "Local"
			},
			{
			  "file_path": "/var/log/nginx/access.log",
			  "log_group_name": "/Development/Liunx/",
			  "log_stream_name": "{local_hostname}-{ip_address}-nginx-access-log",
			  "timezone": "Local"
			}
		  ]
		}
	  }
	},
	"metrics": {
	  "aggregation_dimensions": [
		[
		  "InstanceId"
		]
	  ],
	  "append_dimensions": {
		"AutoScalingGroupName": "${aws:AutoScalingGroupName}",
		"ImageId": "${aws:ImageId}",
		"InstanceId": "${aws:InstanceId}",
		"InstanceType": "${aws:InstanceType}"
	  },
	  "metrics_collected": {
		"collectd": {
		  "metrics_aggregation_interval": 60
		},
		"disk": {
		  "measurement": [
			"used_percent"
		  ],
		  "metrics_collection_interval": 10,
		  "resources": [
			"*"
		  ]
		},
		"mem": {
		  "measurement": [
			"mem_used_percent"
		  ],
		  "metrics_collection_interval": 10
		},
		"statsd": {
		  "metrics_aggregation_interval": 60,
		  "metrics_collection_interval": 10,
		  "service_address": ":8125"
		}
	  }
	}
  }
Let’s start and check amazon-cloudwatch-agent service
systemctl start amazon-cloudwatch-agent.service
systemctl status amazon-cloudwatch-agent.service
Make sure coudwatch-agent service is in running status

Validating Linux logs and Nginx access logs in CloudWatch Portal
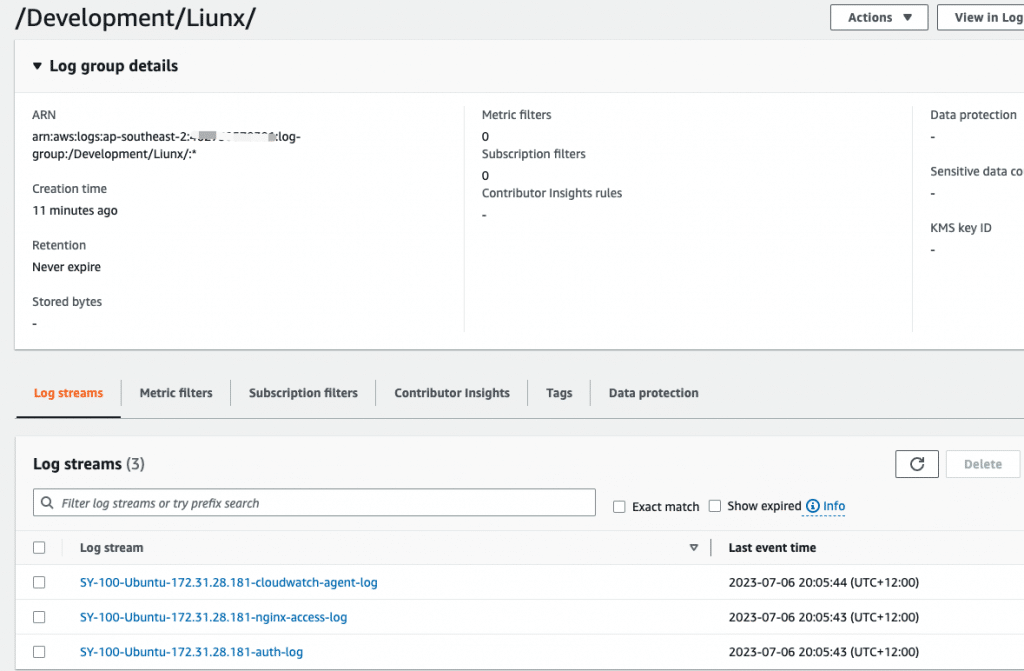
Let’s check again in CloudWatch Dashboard, you can see /Development/Linux/ log group has been created.

Select /Development/Linux Log group, you can see the log steam name that I defined in configuration.
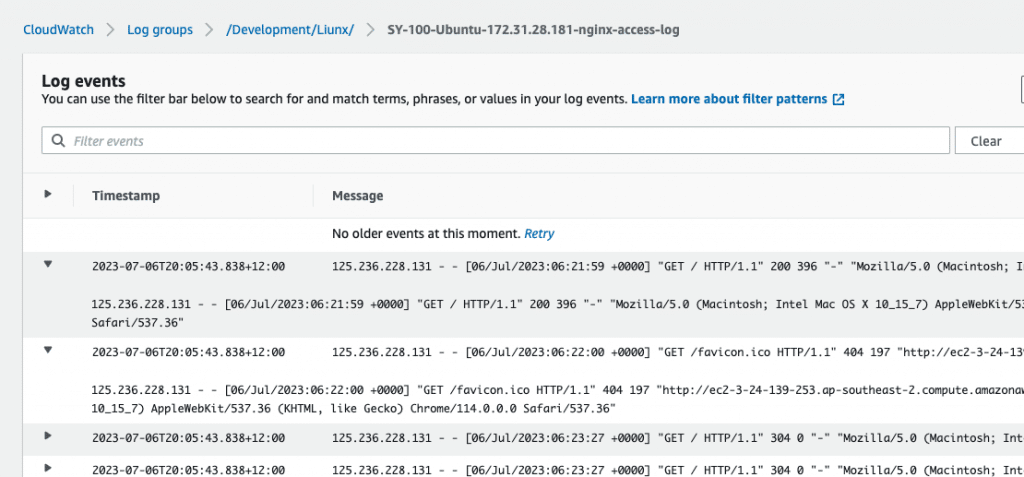
When nginx-access-log is selected, you can see the detailed log of Nginx.
Conclusion
I have demostrated how to install and configure CloudWatch agent, and how to send Windows Event log, Linux system log, and application log to the CloudWatch service. You can place the CloudWatch agent configuration file in the parameter store. Moreover, you can also store configuration file in you customized AMI to automate the process when needed.